Measurement · 6 min read
Ecommerce email marketing metrics: how to read Klaviyo reports without confusing attribution with growth
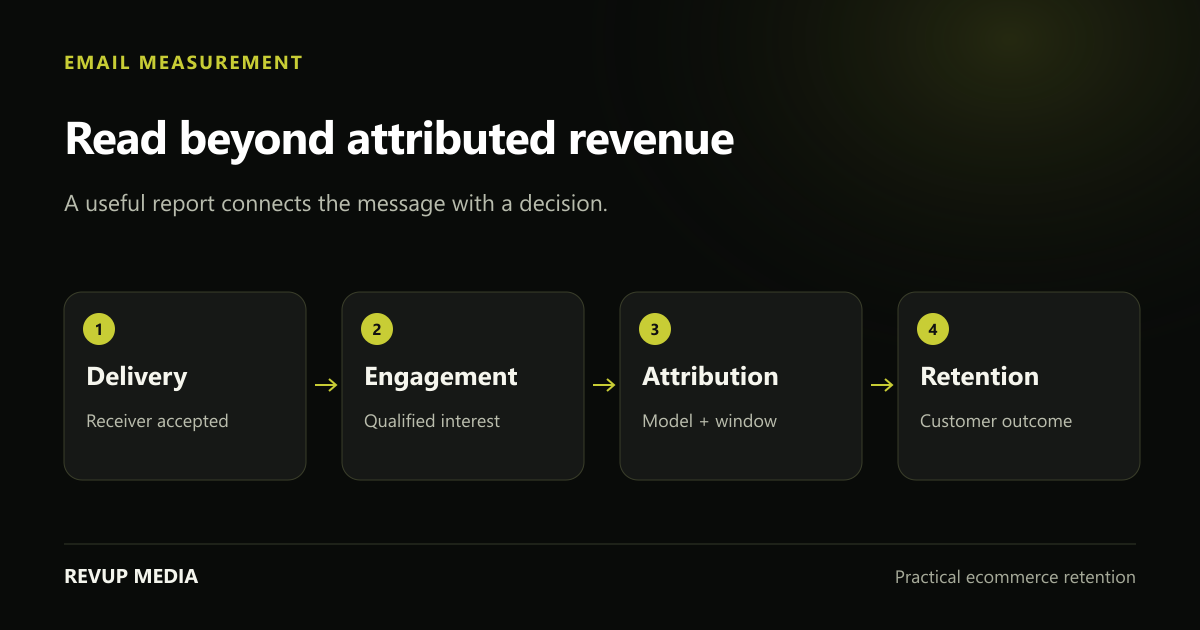
Ecommerce email marketing metrics are useful when they answer a decision. A report should help you understand who received a message, what they did, and whether the customer and commercial outcome justify the work.
Start here
Keep definitions and attribution settings consistent. Attributed revenue is useful reporting evidence, but it is not the same as incremental revenue, profit or a guaranteed share of store growth.
Start with the question, then choose the metric
A campaign launch, a welcome flow and a product-education email have different jobs. Before opening the dashboard, write the question: Did qualified people receive the message? Did it lead to relevant product interest? Did customers order? Did first-time buyers return later?
Keep the audience and period attached to every result. A small VIP audience can have a high revenue per recipient while producing a lower total than a broad launch. That does not make one automatically better. It shows that the campaigns reached different groups for different reasons.
Record any changes to offer, traffic source, inventory or attribution settings. Comparing a full-price education email with a major sale only by revenue obscures the context that produced the number. Useful reporting makes those differences visible.
Read delivery and negative feedback before celebrating reach
Distinguish attempted sends from delivered messages and from inbox placement. Delivered generally indicates receiver acceptance; it does not prove the recipient saw the email in the primary inbox. Read bounce or rejection information when there is a sudden change.
Review unsubscribes and complaints alongside audience growth. A larger list that generates more unwanted mail may be a worse asset than a smaller qualified audience. Compare the acquisition sources and recipient groups involved rather than attributing the problem immediately to design.
Use open rate as a contextual signal. Privacy-related preloading can inflate recorded opens, and reporting definitions vary. Clicks and purchase activity can add evidence, but clicks may also need bot-filtering context. No single engagement metric provides a complete picture.
Use clear formulas and the right denominator
Agree on definitions before comparing reports. A click rate can mean unique clickers divided by delivered emails, while click-through measures elsewhere may use different denominators. Label your own worksheet rather than assuming every exported field means the same thing.
For an illustrative campaign with 10,000 delivered messages, 180 unique clickers, 40 attributed purchasers and $3,200 attributed revenue, the unique click rate is 1.8%, purchasers per delivered recipient is 0.4%, and attributed revenue per delivered recipient is $0.32. Those figures describe the selected reporting model and period; they do not establish causation.
When using a platform’s built-in revenue per recipient, check whether its denominator and filters match your worksheet. Differences can be legitimate if one report includes a different recipient count, attribution window or order metric. Reconcile the definitions before calling either result wrong.
| Metric in a labelled worksheet | Formula | Useful question |
|---|---|---|
| Unique click rate | Unique clickers ÷ delivered × 100 | Did the message generate relevant interest? |
| Purchasers per delivered recipient | Attributed purchasers ÷ delivered × 100 | How much buying activity is credited to the send? |
| Attributed revenue per delivered recipient | Attributed revenue ÷ delivered | How does value compare across similar sends? |
| Repeat-purchase rate for a defined cohort | Repeat purchasers ÷ eligible cohort customers × 100 | Are first-time buyers returning in the chosen period? |
Treat attribution as a model with settings
An email platform assigns credit according to its attribution rules, eligible interactions and time windows. A purchase credited to email may also appear in another platform’s report. Adding channel-reported revenue totals can therefore exceed actual store revenue.
Write the current settings next to your review and check them before comparing periods. A change to the window or interaction treatment can alter reported revenue even if customer behaviour stays similar. Review the selected order metric and any exclusions too.
Use attributed revenue to understand performance within a consistent framework. For incremental impact, a controlled holdout or other appropriate experiment provides stronger evidence than a dashboard percentage alone. If a clean test is not feasible, be honest about the limit and reconcile with overall store behaviour.
Source and context: Klaviyo: attribution documentation ↗. Consult Klaviyo’s current attribution documentation and your actual account settings when interpreting credited orders. Platform credit should not be presented as proof that email independently caused every attributed purchase.
Connect email results with contribution and retention
Revenue does not account for product cost, discounts, fulfilment, returns or marketing costs. Work with the store’s actual contribution model when comparing offers. A deeper discount can increase attributed sales while reducing the value retained per order.
For retention, define a cohort and allow time for repeat buying. First-time customers from a Black Friday promotion may behave differently from full-price subscribers acquired through a product guide. Compare similar cohorts and document differences in product, channel and season.
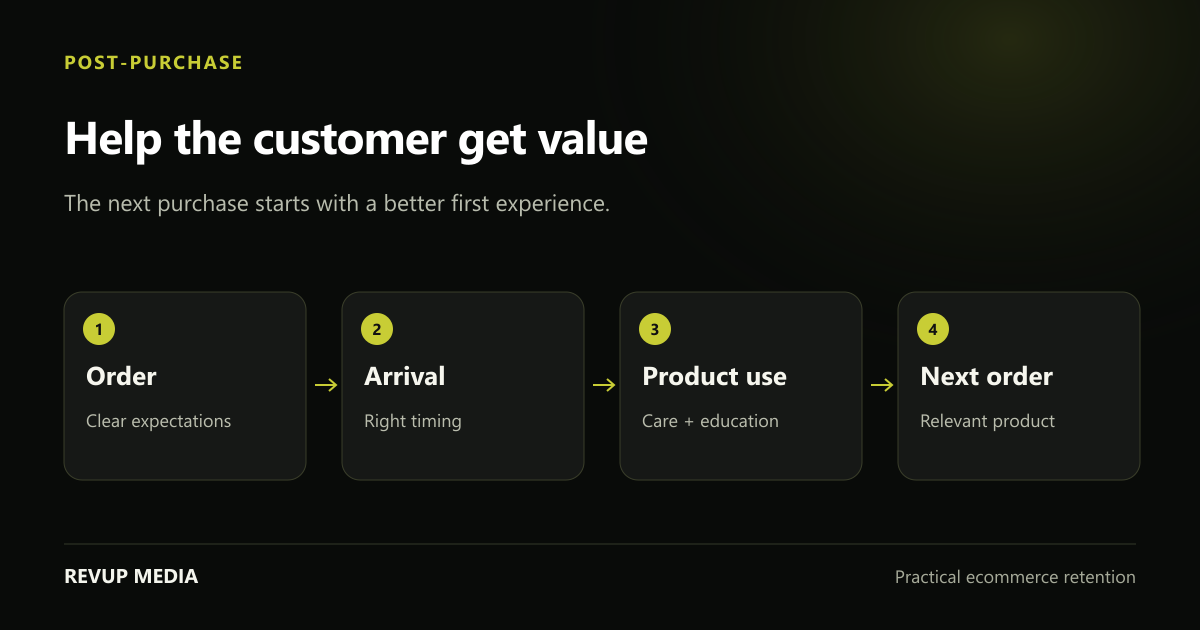
Track the customer outcome the journey was designed to improve. A post-purchase guide may support product use; a replenishment reminder may support a timely reorder. These outcomes are worth examining even when the immediate message revenue is modest, while avoiding unsupported claims that one email caused all downstream improvement.
Turn the weekly review into a short decision log
Use a small dashboard with audience, delivered count, meaningful clicks, attributed orders, revenue per recipient and negative feedback. Add the commercial context and one next action. A useful review ends with a decision, not a screenshot collection.
Inspect outliers before making broad changes. A missing product, broken link or stockout can explain poor conversion. A different acquisition mix can explain changes in engagement. If a result rests on very few orders, note the uncertainty rather than presenting a precise percentage as a stable trend.
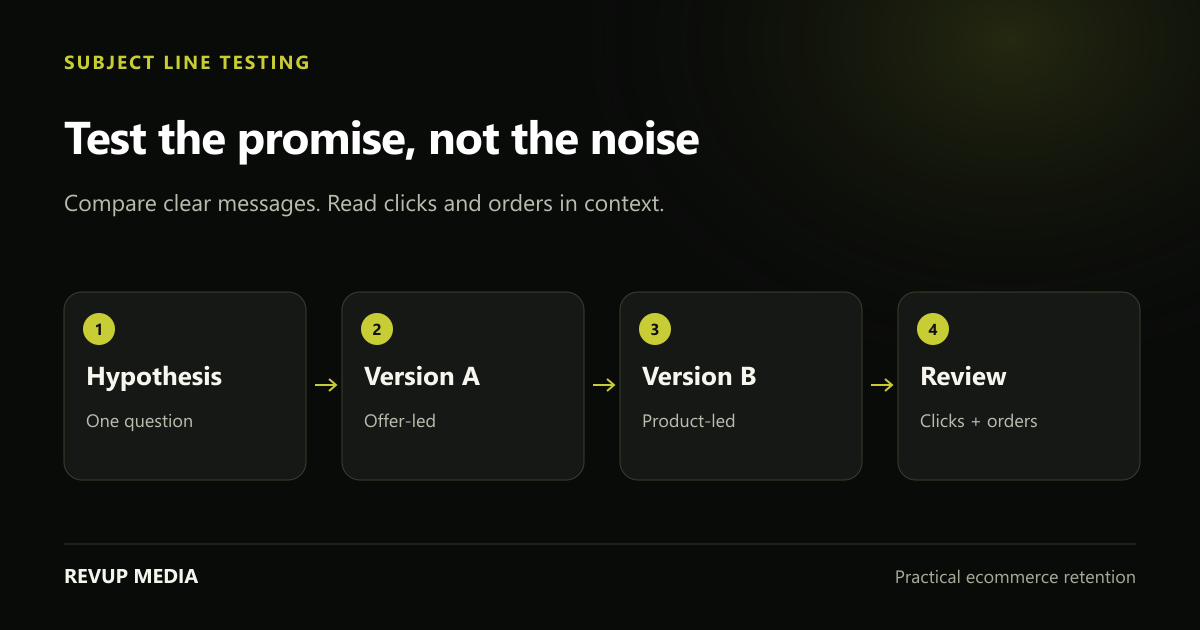
Maintain one experiment queue. Choose a hypothesis, a primary measure, a comparable audience and a review window. Record what changed and what you learned. Over time, that process gives the team stronger evidence than repeatedly chasing an industry average that may describe a very different store.
- Record audience, timeframe and metric definitions.
- Keep attribution settings attached to reported revenue.
- Reconcile campaigns with store sales and contribution.
- Turn each review into a specific action or a clearly stated uncertainty.
Common questions
What percentage of ecommerce revenue should email generate?
There is no universal target that proves a healthy program. Store maturity, product cycle, paid acquisition, promotions and attribution settings affect the reported share. Review contribution and customer outcomes as well as attributed revenue.
Is open rate still useful?
It can provide context, but privacy behaviour and reporting differences limit its accuracy. Combine it with reliable clicks, purchases, delivery evidence and negative feedback.
Need a plan for your store?
Turn the next useful idea into action.
We review your campaigns, flows, signup experience and customer journey to identify the work worth doing first.
Book Your Free Audit →Discuss ecommerce email reporting and strategy →